Mastering Location Data: Geospatial Magic Meets Databricks Power
Ever used Google Maps to find your way around? That’s geospatial data in action! It’s information tied to a place on Earth-like where your favorite ice-cream shop is, where roads go, where cities are expanding, and how places change over time, just to name a few.
GIS, or Geographic Information Systems, takes this data and turns it into smart maps and tools that help people make better decisions. From choosing the safest route for a delivery truck to planning where to build a new hospital or identifying areas at risk of floods or urban heat islands, GIS helps us understand where things happen and how we can use that insight to make better decisions.
Geospatial experts often use tools like FME or ArcGIS to look at maps and analyze location data. They usually keep their data in databases like Postgres or Oracle Spatial, and write code in SQL or Python using libraries like PostGIS, GeoPandas, GDAL, or PDAL to get the job done.
But today, we’re dealing with way more data than before. That’s where platforms like Databricks come in. It’s a modern tool that can handle huge amounts of data, run complex workflows faster, and work alongside the tools geospatial folks already use. Think of it as a powerful new teammate for your geospatial projects.
Where should you begin your journey into geospatial data on Databricks? The good news is that RevoData is offering a specialized training session focused entirely on using Databricks for geospatial workflows. This session will guide you through the essentials of working with Databricks. We’ll also look at how Databricks works together with other geospatial tools like FME, ArcGIS, and Postgres. Whether you’re just getting started or looking to optimize your current processes, this training will help you understand the core principles and practical applications of geospatial data integration within the Databricks ecosystem.
You’ll explore the benefits of migrating your geospatial workflows to Databricks, leveraging its modern lakehouse architecture that merges scalable storage with lightning-fast analytics. We’ll walk through the key Python and Spark libraries that enable efficient and flexible spatial data processing, helping you unlock Databricks’ full potential. By the end of the session, you’ll have a clear understanding of when and how to make the shift, and the tools you’ll need to get there.
This training is designed to be hands-on and practical, with exercises that guide you through real-world applications. We’ll work with a variety of geospatial data types – including vector data (like topographic maps and point clouds), raster data (such as aerial imagery and netCDF files), and even graph-based data – to solve meaningful geospatial problem.
Here’s a quick sneak peek at the hands-on training cases:
SQL Server executes queries within a single-node environment, meaning all operations—such as joins, aggregations, and filtering—occur on a centralized database server. The query optimizer determines the best execution plan, using indexes, statistics, and caching to improve efficiency. However, performance is ultimately limited by the resources (CPU, memory, and disk) of a single machine.
Databricks, powered by Apache Spark, distributes query execution across multiple nodes in a cluster. Instead of a single execution plan operating on one server, Spark breaks down queries into smaller tasks, which are executed in parallel across worker nodes. This approach enables Databricks to handle massive datasets efficiently, leveraging memory and compute resources across a distributed system.
Location-allocation
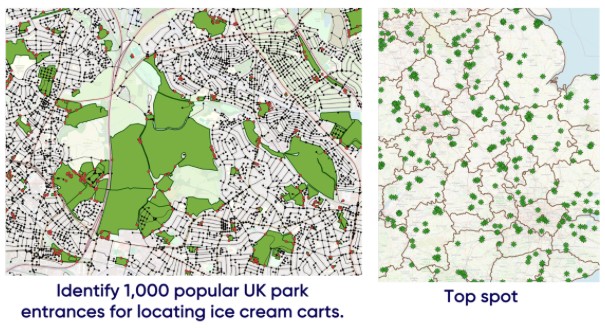
Location-allocation problem: Summer’s almost here, and what better way to celebrate than with a sunny use case? We’ll dive into a geospatial analysis to uncover the top 1,000 sweetest spots in the UK to park an ice cream cart and scoop up the highest profits.
Shortest path between A and B
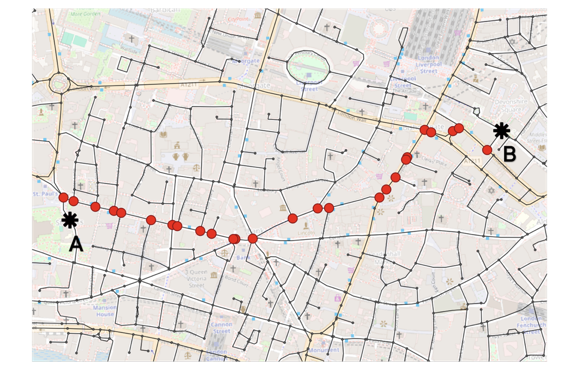
Shortest path calculation: The shortest path algorithm is one of the most widely used techniques in network analysis, often applied to optimize routes and reduce travel time. In this case, we’ll use it to map out the most efficient paths from a well-known landmark to all other locations within a selected area in the UK, helping us better understand connectivity and accessibility across the region.
Change Detection
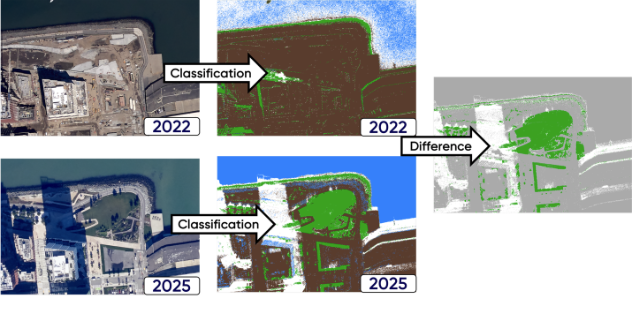
Temporal change detection using aerial images: This use case compares high-resolution (0.25 meter) aerial orthophotos with RGB and infrared bands from 2022 and 2025 to detect changes in land use, buildings, and vegetation in SoMa, San Francisco. The results support urban planning and development decisions by highlighting growth and transformation in the neighborhood.
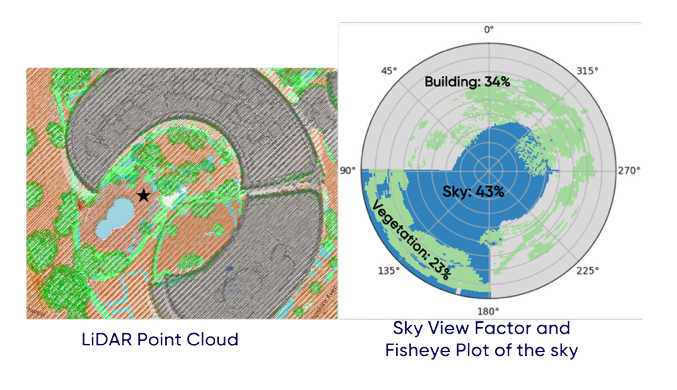
Sky View Factor
Temporal change detection using aerial images: This use case compares high-resolution (0.25 meter) aerial orthophotos with RGB and infrared bands from 2022 and 2025 to detect changes in land use, buildings, and vegetation in SoMa, San Francisco. The results support urban planning and development decisions by highlighting growth and transformation in the neighborhood.
In the upcoming posts, we’ll dive deeper into each use case. Stay tuned!

Melika Sajadian
Senior Geospatial Consultant at RevoData, sharing with you her knowledge about Databricks Geospatial